The Dashboard Report provides a comprehensive overview of your restaurant's key operational metrics for a specified time period. This report covers various aspects of sales, payments, employee performance, and more, allowing you to manage and analyze your restaurant's performance effectively.
Table of Contents
- Dashboard Report Introduction
- Accessing the Dashboard Report
- Detailed Report Sections
The Dashboard Report assists in monitoring the overall performance of your restaurant. It consolidates various critical metrics into one report, giving you a clear picture of your operations. For more detailed information, you can select 'See full report' in each section.
To access the Dashboard report, follow these steps:
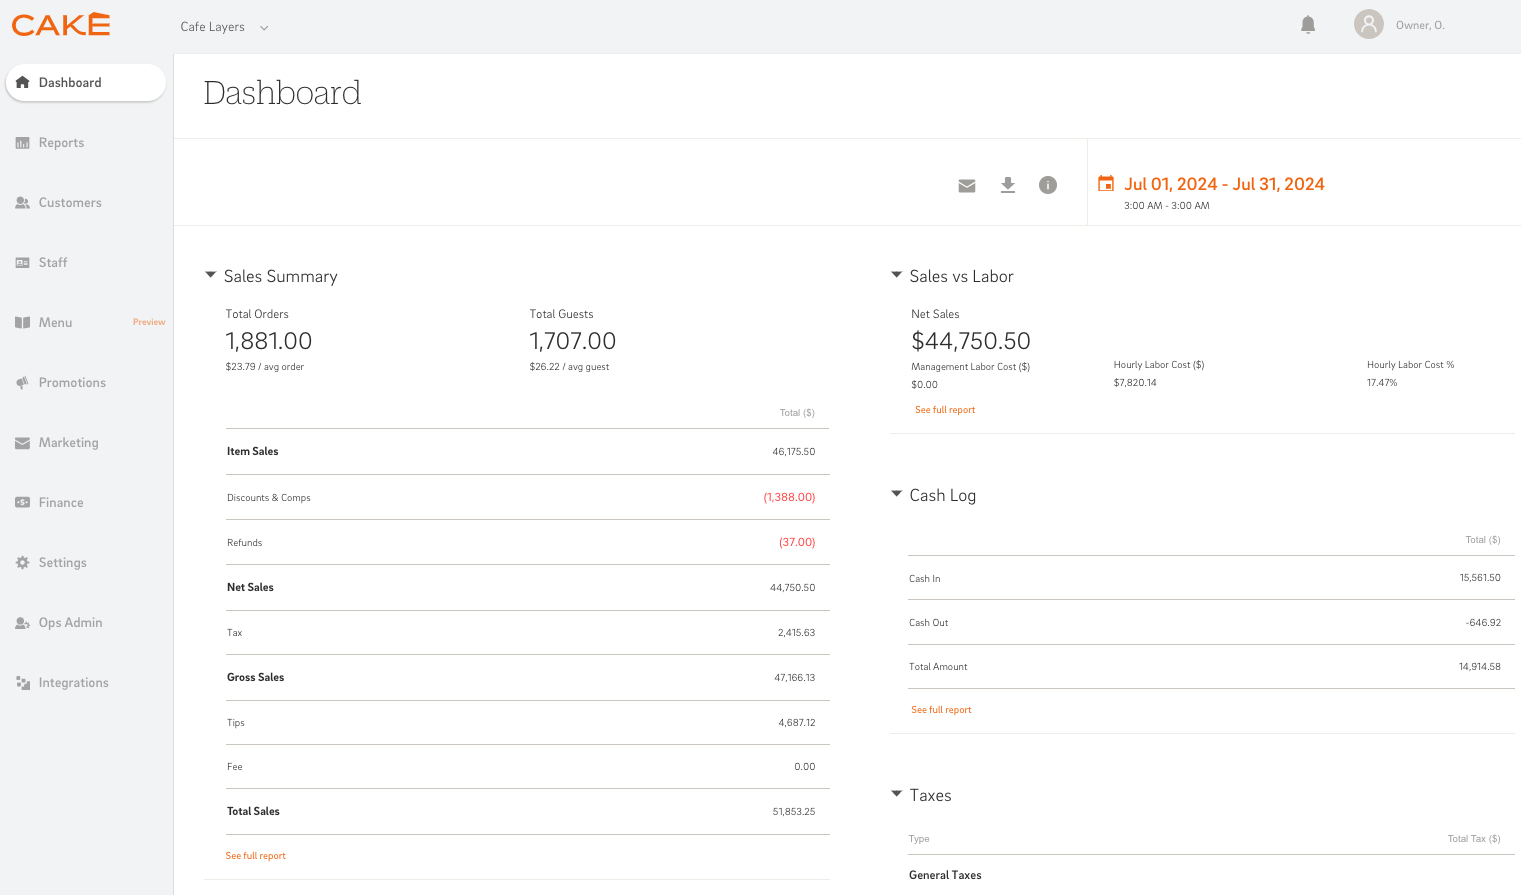
- Log into CAKE Admin Portal: Navigate to Admin Portal via Dashboard.cake.net.
- Navigate to 'Dashboard': On the left-side navigation bar, select the 'Dashboard' option located at the top.
The Dashboard Report includes the following report summaries for the set date range.
- Accessing the Full Report: Each section provides a 'See full report' button to easily access the full report.
Sales Summary
The Sales Summary section displays total item sales, discounts, refunds, taxes, and tips, providing an overview of your revenue and key deductions.
Sales Category Sales
This section shows the breakdown of sales by different sales categories, helping you understand which categories contribute most to your revenue.
Order Type Sales
Order Type Sales breaks down sales by order type, such as dine-in, takeout, delivery, etc., allowing you to analyze the performance of each order type.
Payments
The Payments section displays the breakdown of sales by payment type (e.g., Cash, Credit Card, etc.), helping you track the most used payment methods.
Online Sales
This section provides a brief summary showing the number of online orders received and the revenue generated from these orders.
Register Sales
Register Sales shows the breakdown of sales by each register, helping you track the performance of different registers.
Employee Sales
This section displays the breakdown of sales by employee, allowing you to see which employees are generating the most sales.
Sales vs Labor
The Sales vs Labor section shows net sales, exempt and non-exempt labor cost, and the percentage of net sales that labor costs represent, helping you manage labor efficiency.
Cash Log
This section displays cash in, cash out, and the total amount, allowing you to track cash flow in your restaurant.
Taxes
The Taxes section shows different tax types and the amounts collected, providing a clear picture of your tax liabilities.
Tips
This section shows POS tips (declared tips + card tips) and OLO tips, giving you insight into the tipping behavior of your customers.
Gift Card Sales
Gift Card Sales shows the total gift card sales, refunds, cash redeemed, and tips on both activations and reloads, helping you track the performance of your gift card program.
Discount & Comps
This section displays discounts and comps by reasons and amounts, helping you understand the impact of promotions and other discounts.
Voids
The Voids section shows details of items/orders that were deleted after being sent to the kitchen and the orders that were reopened, helping you track and manage voided transactions.
The Dashboard Report is a great tool for managing and tracking your restaurant's performance. By leveraging the detailed insights provided in each section, you can ensure accurate and effective management of your restaurant's operations. Use this report to make data-driven decisions and enhance overall efficiency and profitability.
Mastering CAKE Reports