Managing multiple restaurant locations can be a challenging endeavor. With CAKE's Multi-Location Reports, you can easily access and analyze important data across all your locations. This guide will walk you through accessing these reports and explain the different types of reports available, helping you make informed business decisions.
Table of Contents
- Accessing Multi-location Reports
- Multi-location Reports
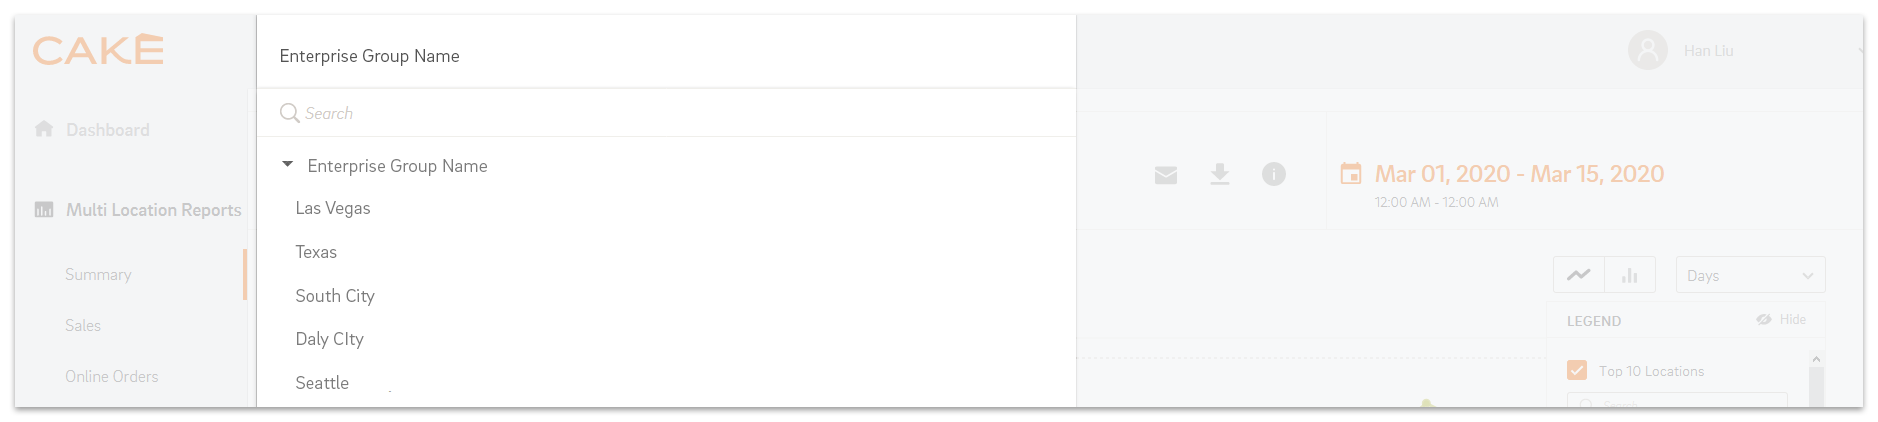
To access your Multi-Location Reports, follow these steps:
- Log into Admin Portal: Start by logging into the Admin Portal via Dashboard.cake.net.
- Select a Location: Upon logging in, you will be prompted to select a location. Choose the Enterprise level, indicated by a black arrow to the left. Clicking this arrow will reveal all individual locations.
Back to Top
Once you're in the correct location, you can access a variety of multi-location reports. These reports are crucial for tracking and comparing performance across your locations.
Multi-Location Reports Include:
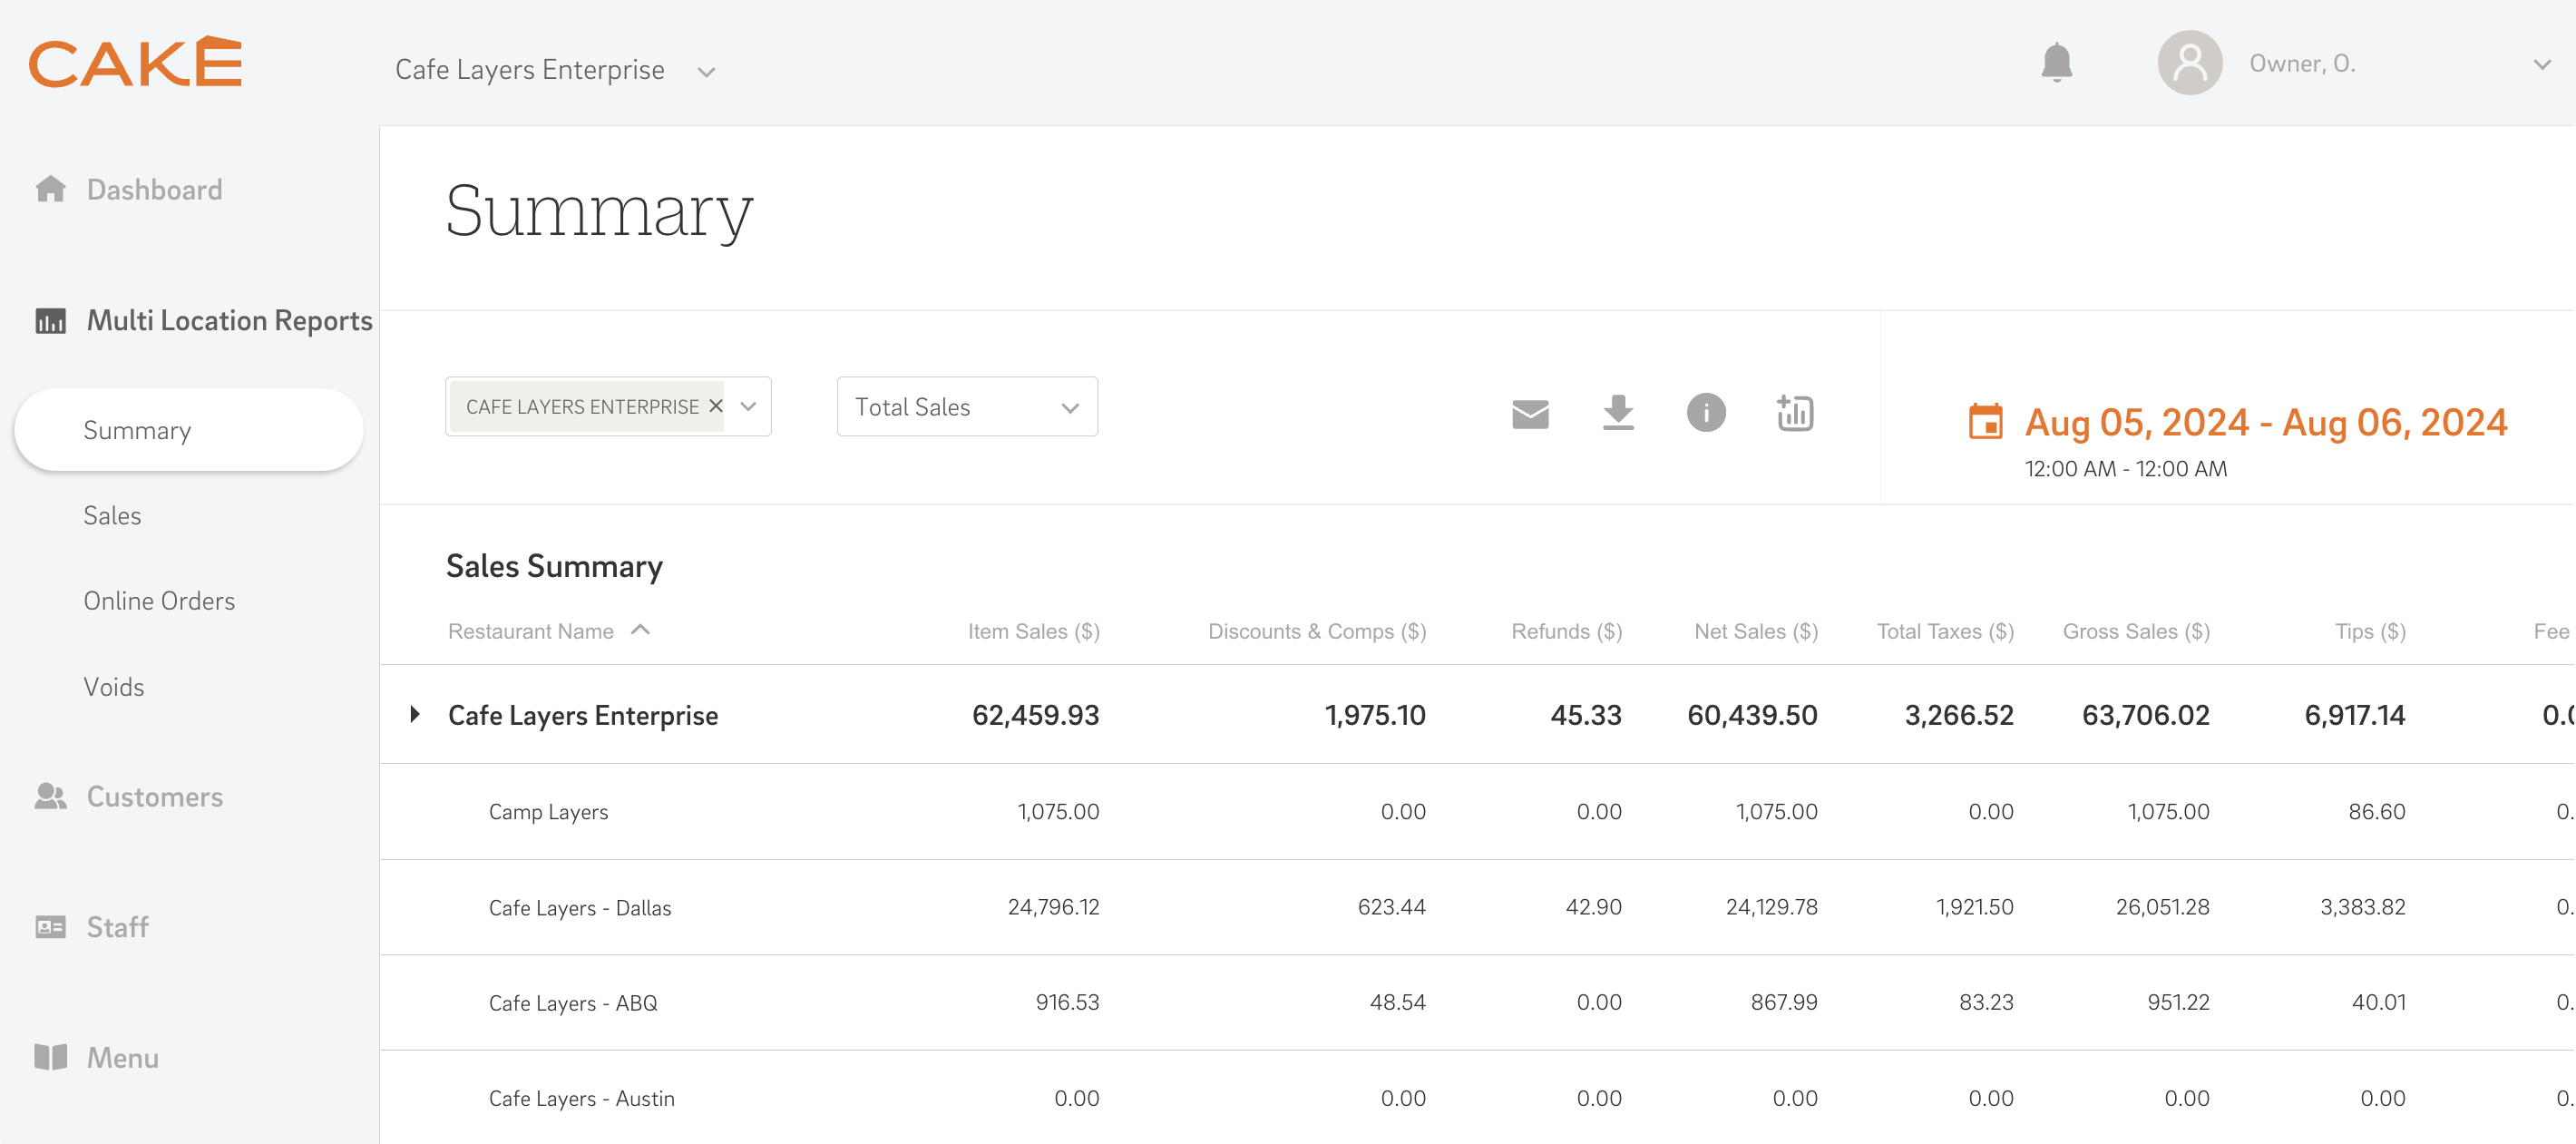
The Summary Report provides a comprehensive overview of all sales across a specified time period, including both in-store and online sales.
Filter Options:
The Summary report can be filtered by the following options:
- Total Sales: The total revenue generated.
- Gross Sales: Total sales including tax.
- Net Sales: Sales minus discounts, comps, and refunds.
- Item Sales: Revenue from individual items.
- Total Orders: The number of transactions (excluding refunds).
- Total Guests: The total count of guests (default is 1 if no guest count is available).
Data Table:
The data table includes the following metrics and formulas:
- Item Sales = Sales amount
- Discounts & Comps = Total amount of % or $ discounts, free items, or rewards
- Refunds = Total refunds in $ amount
- Net Sales = Item Sales - (Discounts & Comps + Refunds)
- Total Tax = Total amount of Tax ($)
- Gross Sales = Net Sales + Tax
- Tips = Tips + Service charge
- Fee = Card Extra fee + Any other Extra fee
- Total Sales = Gross Sales + Tips + Fee
- Total Orders = Total number of transactions (excluding refunds)
- Total Guests = Total Guest Count (when there is no guest count, 1 is the default count)
NOTE: Voids (items/orders deleted after they were sent to the kitchen) are not considered in this report.
Back to Top
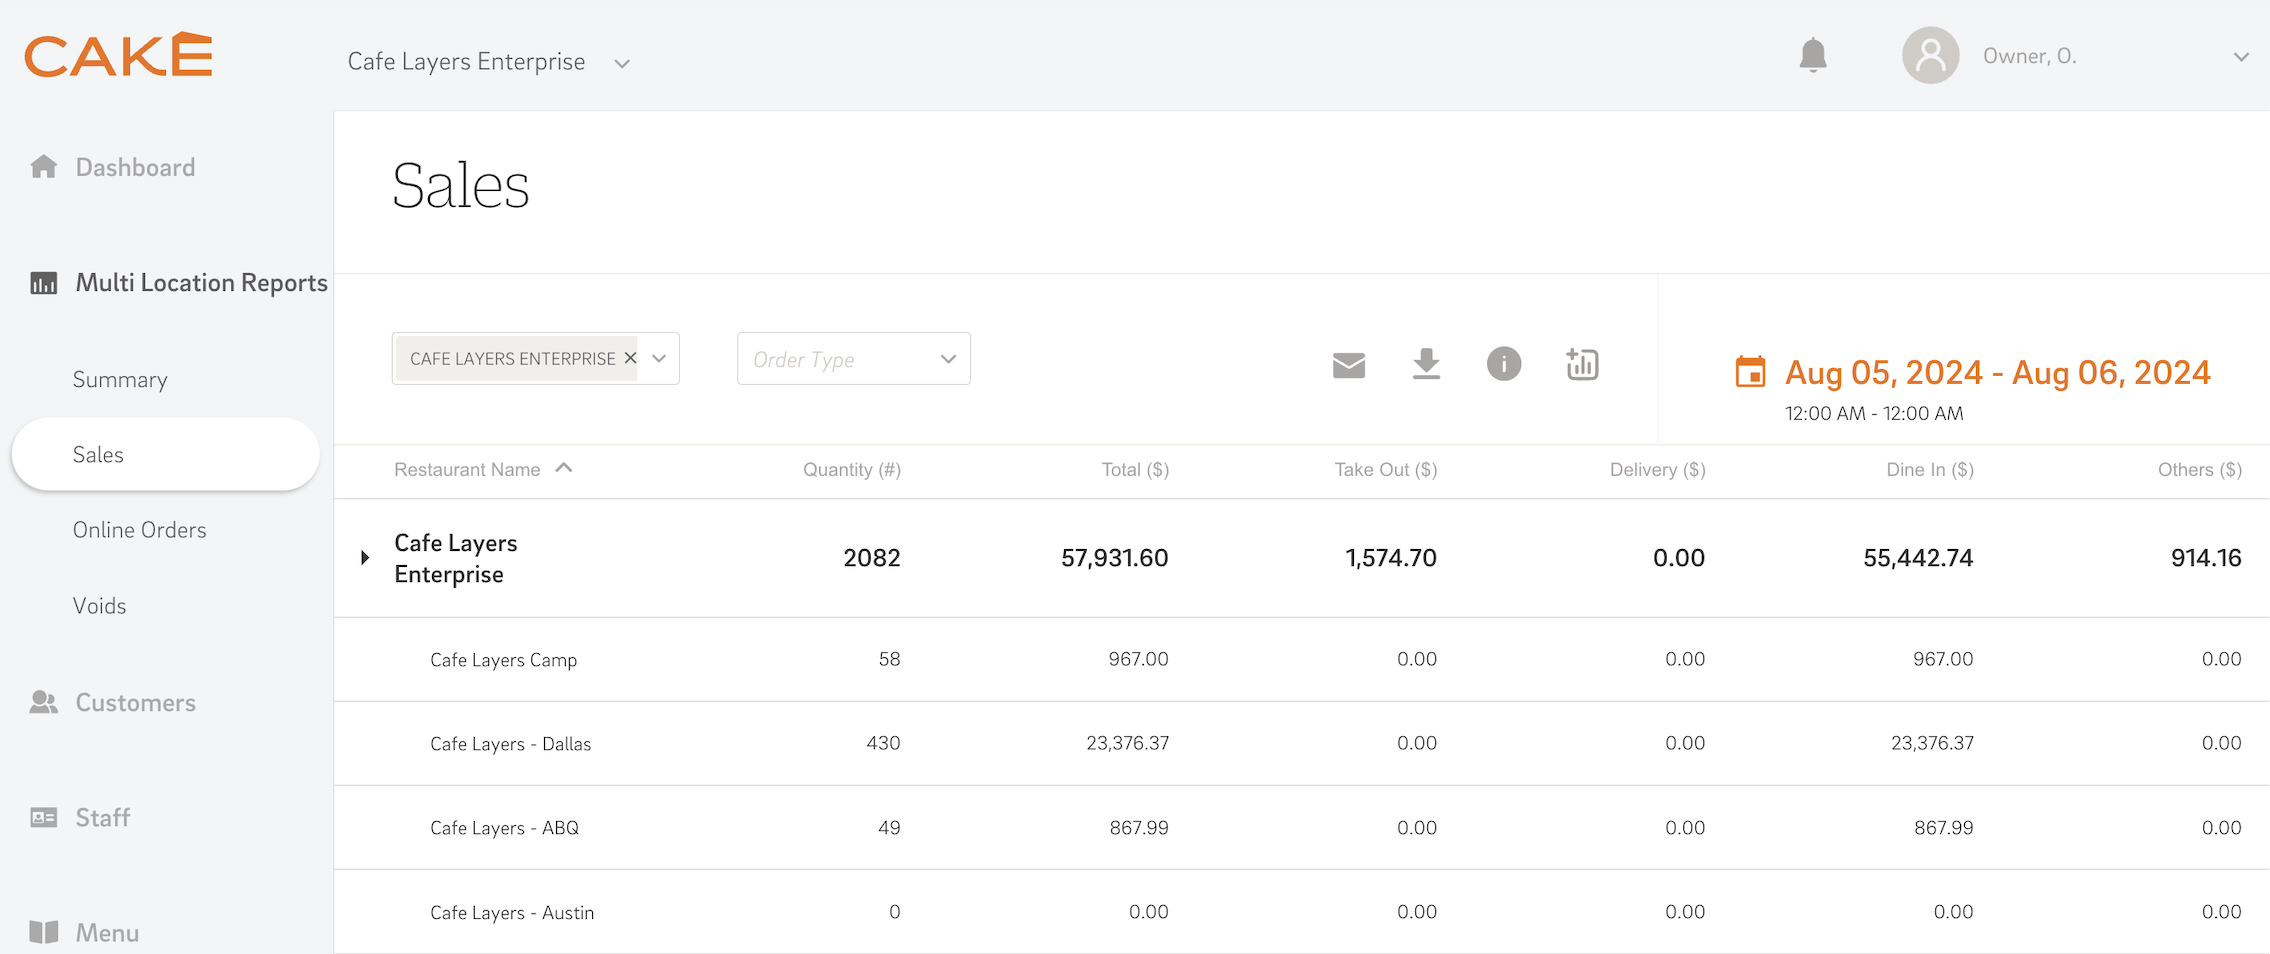
The Sales Report details all sales across a specific time period.
Filter Options:
The Sales report can be filtered by the following options:
- Order Type: Includes common types like Takeout, Delivery, and Dine-In, as well as customized types, recorded under 'Others'. Custom order data can be filtered for specific analysis. Calculations are based on Net Sales.
- Payment Type: Covers common payment methods like Card, Cash, and Gift Card, and unique third-party payment types, recorded under 'Others'. Specific data can be filtered, with calculations based on Total Sales.
Data Table:
The data table includes the following metrics:
- Restaurant Name: Names of all restaurant locations.
- Quantity (#): Total number of items sold.
- Total ($): Total sales amount in dollars.
- Take Out ($): Sales amount from takeout orders.
- Delivery ($): Sales amount from delivery orders.
- Dine In ($): Sales amount from dine-in orders.
- Others ($): Sales from other order types.
Back to Top
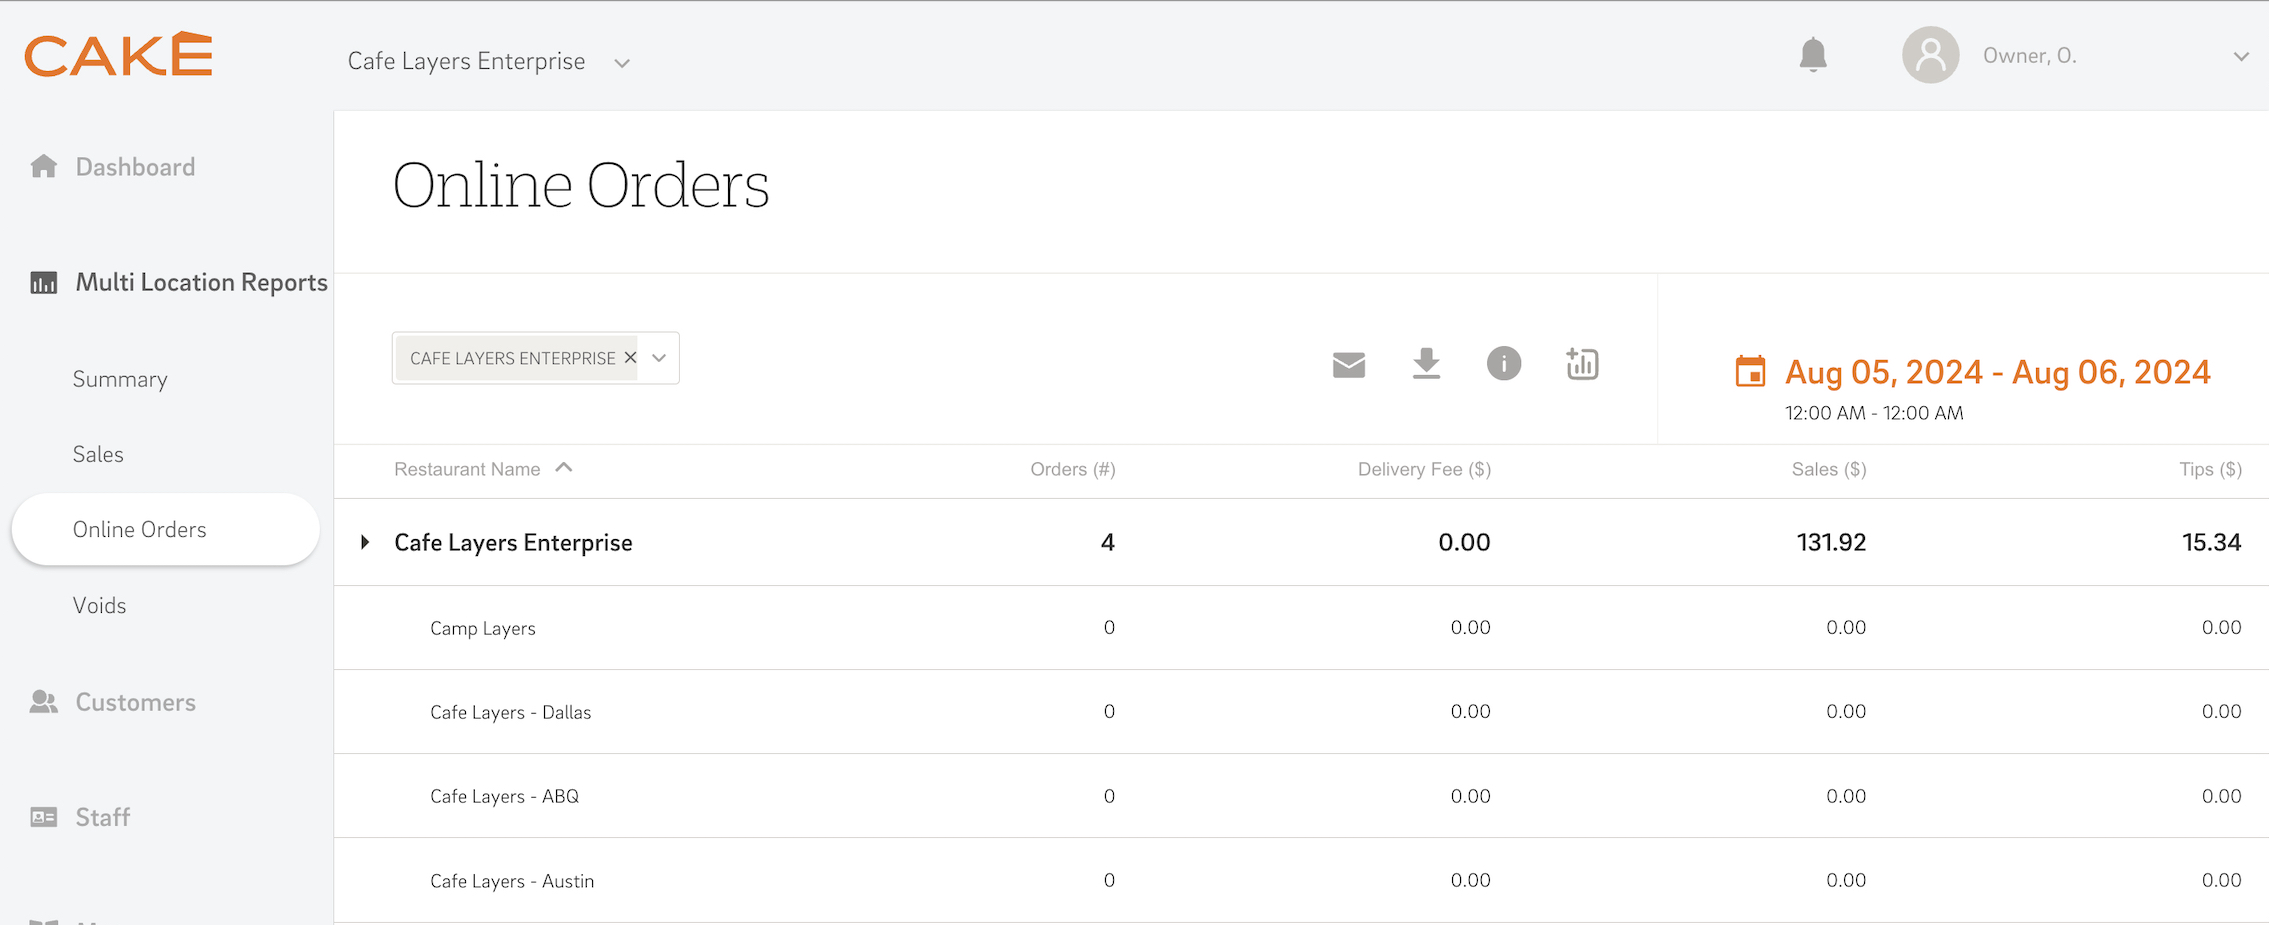
This report focuses solely on online sales, detailing the performance of online transactions across all locations during the selected period.
Data Table:
The data table includes the following metrics:
- Restaurant Name: Names of all restaurant locations.
- Orders (#): Total number of online orders.
- Delivery Fee ($): Fees associated with online delivery.
- Sales ($): Revenue from online orders.
- Tips ($): Tips collected from online orders.
Back to Top
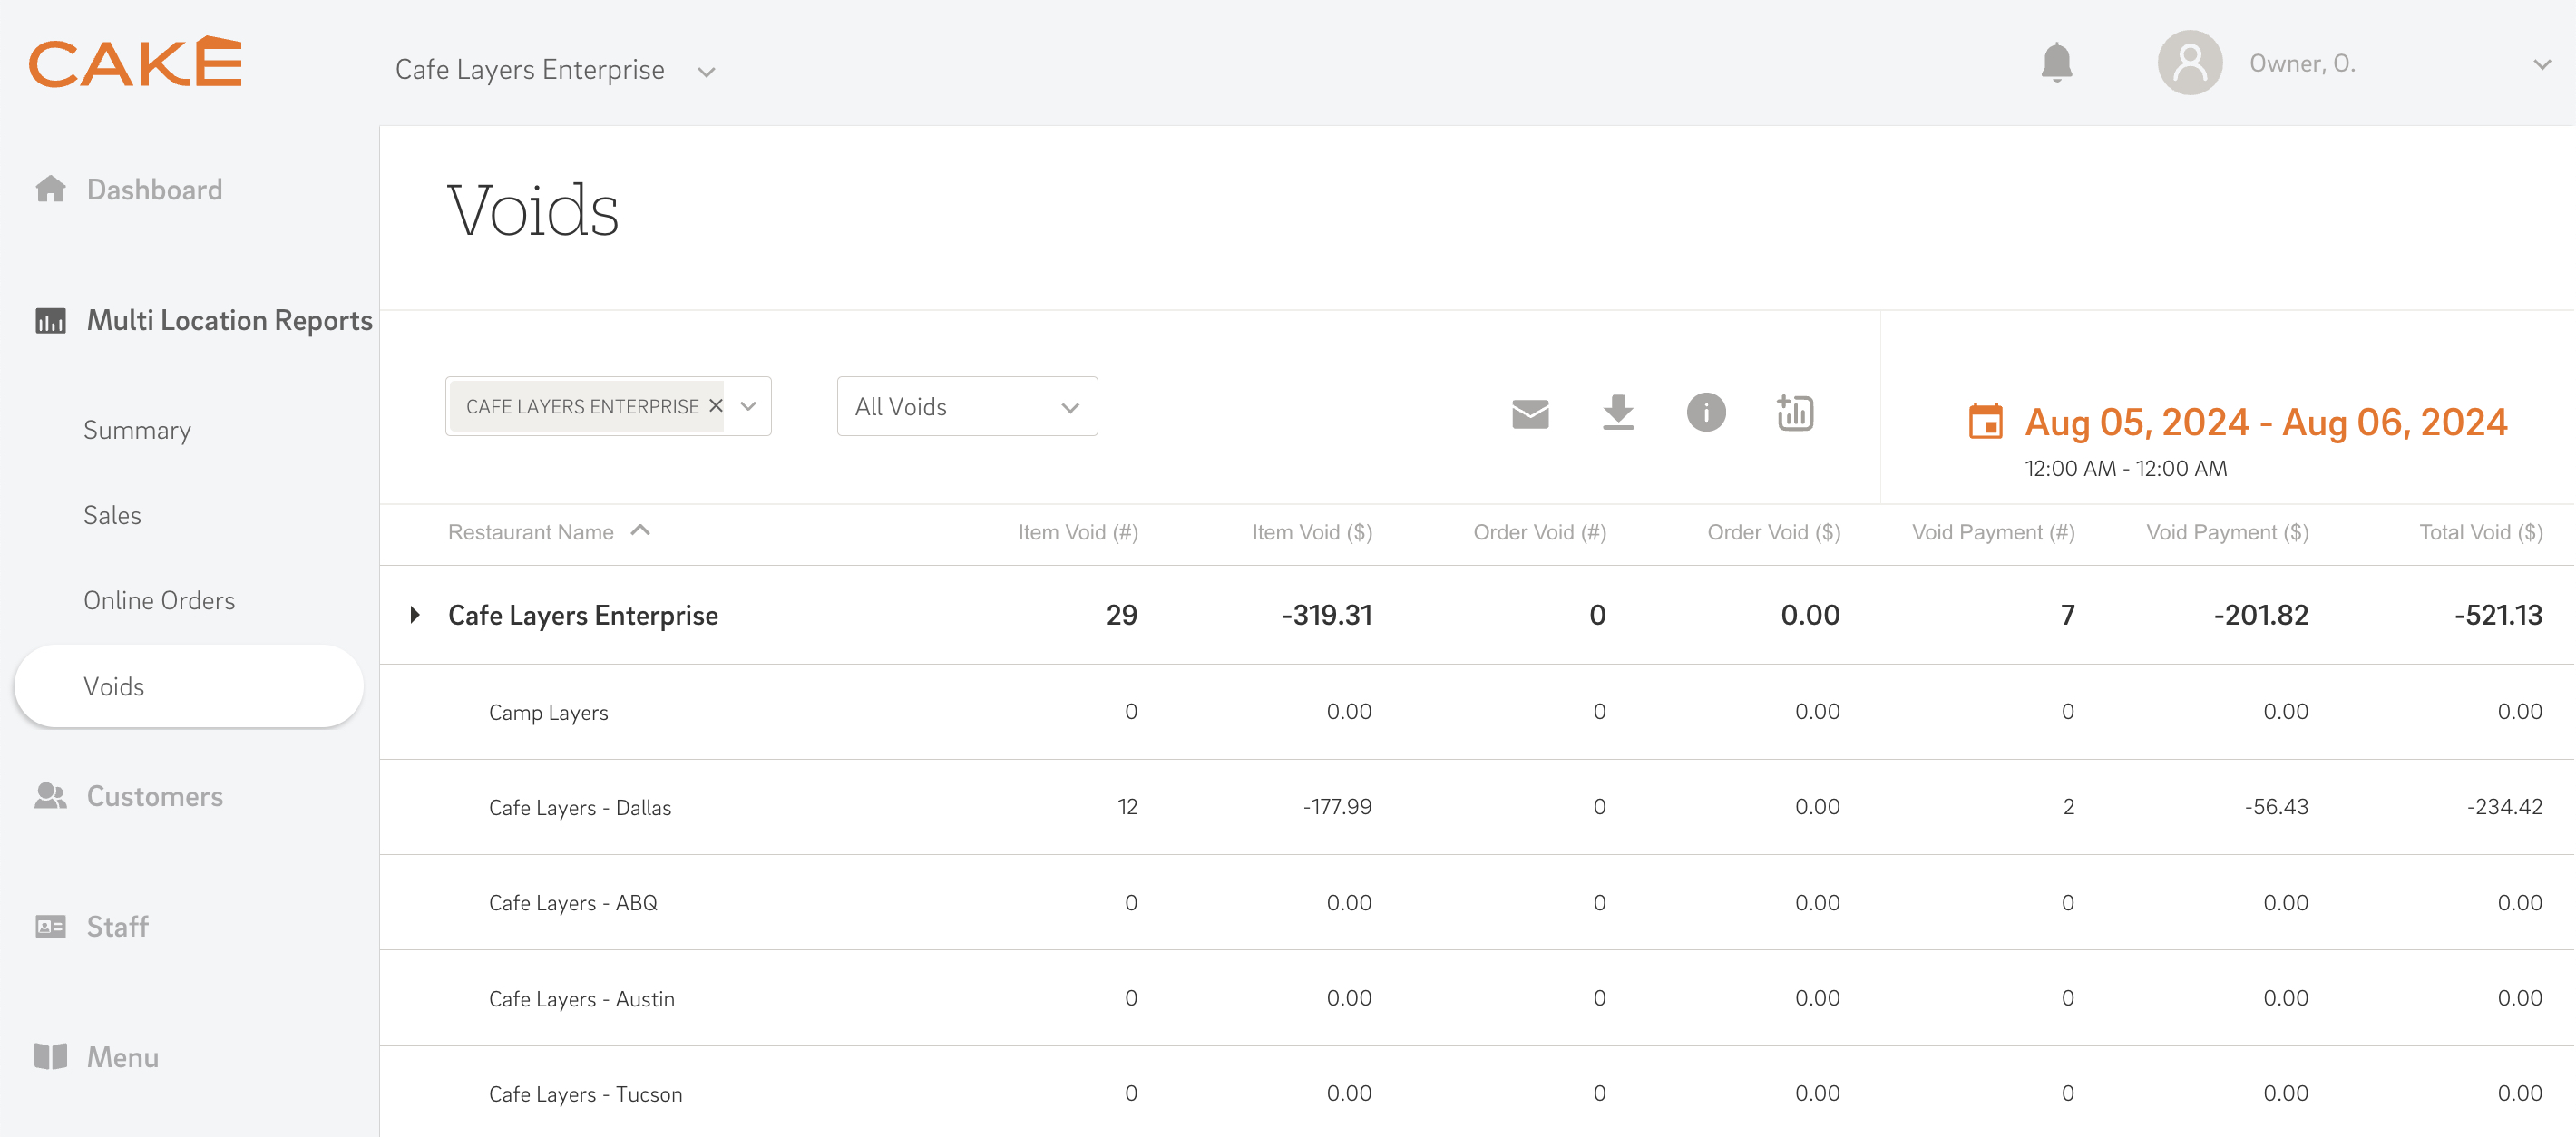
The Voids Report provides data on all item voids, order voids, and reopened orders. An item is voided if deleted after being sent to the kitchen, while an order is voided if the entire order is deleted post-sending. The report also includes items deleted for any reason before being sent to the kitchen.
Filter Options:
The Voids report can be filtered by the following options:
- All: Total voids and deletes within the selected date range.
- Item Voids: Specific voided items.
- Order Voids: Complete voided orders.
- Void Payment: Financial impact of voids and re-openings.
Data Table:
The data table includes the following metrics:
- Restaurant Name: Names of all restaurant locations.
- Item Void (#): Number of voided items.
- Item Void ($): Total value of voided items.
- Order Void (#): Number of voided orders.
- Order Void ($): Total value of voided orders.
- Void Payment (#): Number of void payment occurrences.
- Void Payment ($): Total value associated with void payments.
Understanding and effectively utilizing CAKE's Multi-Location Reports can greatly enhance your ability to manage multiple restaurant locations. By consolidating critical data into comprehensive reports, you can make informed decisions that drive your business's success. If you need further assistance, our support team is always here to help.
Back to Top
Mastering CAKE Reports